
Geometrical distortion: the Fishtank Effect
A geometrical distortion happens whenever recorded distances in the sample under a microscope are actually different in reality. This happens for example in the presence of a refractive index (RI) mismatch (which also provokes spherical aberration!). The objective moves along the optical axis a certain distance (a z step that is recorded in the data file), but the focus shifts inside the sample at an actual different step! Therefore objects will appear shortened (as in a fish tank when the objects in the water are viewed from the air) or elongated in the microscope, depending on the ratios of the indices.
In most cases the Z-sampling as specified in the raw data file is the nominal sampling distance, i.e., the distance the table or objective actually moved in Z without taking the refractive index mismatch into account. Contrary to the effect of spherical aberration, the Huygens software will not modify the image geometry automatically as often the refractive index of the embedding medium is not provided in the image metadata and would induce a large error if this is not manually corrected.
Assuming that you have an oil lens (RI = 1.51) and a watery specimen (RI = 1.33) then the object will appear longer. On the other hand, the change from air (RI = 1) to water (RI = 1.33) (for example the straw in your glass of lemonade) will give a shortened, smaller object (= the fishtank effect).
Correcting the geometric distortion
Correcting the distortion (focal shift correction) caused by a mismatch in refractive indices in Huygens is easy: simply adjust the sampling size (sampling interval in Huygens) manually in the microscopic parameters. Huygens deconvolution adapts the Point-Spread-Function (PSF) in case of a mismatch if the theoretical PSF is used. Therefore, do not adjust the sampling size before deconvolution, as this creates a mismatch between the image and the PSF, giving bad deconvolution results. To correct the geometric distortion, deconvolve your image using the microscopic parameters as set during acquisition. After deconvolution, you can manually change the sampling size to correct the geometric distortion!
To determine the geometric distortion, you take the ratio between the lens immersion medium RI and the sample embedding medium RI to give you the elongation factor:
$$ \text{Elongation_factor} = \frac{RI_{lens}}{RI_{medium}} $$
To get the correct Z dimensions, divide the Z sampling interval by this elongation factor.
If the objective (or lens immersion medium) has a higher RI then the sample embedding medium you will get a elongation factor > 1 that will elongate the objects. Dividing the sampling interval by the elongation factor should give a lower value to correct for the elongation.
If the objective (or lens immersion medium) has a lower RI then the sample embedding medium you will get a correction factor < 1 which shortens the objects. Dividing the sampling interval by the elongation factor should give a higher value to correct for the shortening of the objects.Example
As an example, if you have a Z sampling of 180 nm and a water lens with an air medium the correct z-sampling with correction for geometrical distorsion is (1.33/1.00 = 1.33 = the elongation factor) so the corrected dimensions for the geometrical dimensions are then 180 divided by 1.33 = 135 nm.
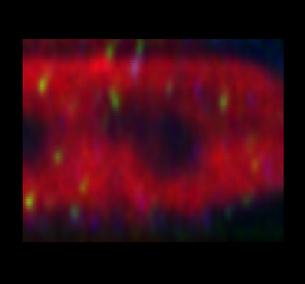
As another example, to the side are images made with the common mismatch of using an oil immersion objective imaging into a water embedded medium.
The first (left) image is still elongated by a factor of ~ 1.13 along the optical axis due to a refractive index mismatch between the oil lens and the water medium (1.51 / 1.33). The second (right) image shows the correction of the distortion by dividing the Z sampling with 1.13 (the elongation factor). So assuming that the nominal z-sampling is 300 nm the corrected for geometric distortion z-sampling = 265 nm (calculation: 300 nm divided by (1.51/1.33) = 265 nm).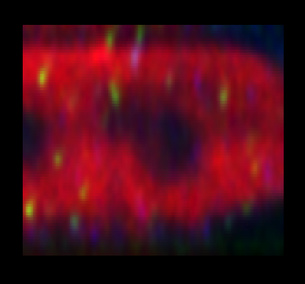
What happens to the aperture angle?
If distances change, then also the aperture angle (the angle subtended by the lens at the focus, but not the Numerical Aperture) will change!!! It is like the apparent bending of a stick half-inmmersed in water (see below)
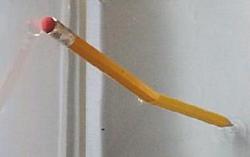 Image from plus magazine
Let's consider a set up with Numerical Aperture NA = 1.2 and Lens Immersion Medium with Refractive Index nl = 1.44. In the graph below, the x axis is the refractive index nm of the Specimen Embedding Medium, that is mismatched except in the point 1.44.
The red curve is the half-aperture angle (degrees) as it happens in the medium: amc = arcsin(NA/nm). The green curve is what is actually observed, in a Paraxial Simplification, due to the geometry distortion caused by the refractive mismatch: amo = atan( (nm/nl) * tanx ). The blue line is a reference: the angle that should be observed in a total match situation: alc = arcsin(NA/nl).
When the sample medium is "denser", we are in the case of the fish tank effect: objects are collapsed on the axial direction, thus angles look wider. The green curve goes above the red one.
When it is the other way around objects look elongated, and the apparent angles are narrower.
This effect is much enhanced in the real case where not only paraxial rays are taken into account. Then the apparent angle (green curve), on the left side of the graph, can even go below the blue line!