
Calibrate the Z sampling
You should not assume that the Z sampling distances of your 3D stacks are the ones reported by the microscope just because it is 'computer controlled'.
It is always a good idea to inspect your stack laterally after setting the image dimensions with the reported Z distances, to see if that makes some sense or not.
You can look at the biological structures themselves, these are very intuitive references to see if anything goes wrong. Are they abnormally flattened or elongated along the Z direction?
You can also look at bright spots in a XZ projection or slice. These should provide an image similar to a PSF (you can calculate the theoretical PSF with the online Nyquist Calculator). The angle of the blur cone (see our FAQ How do you measure the Numerical Aperture (NA) from the experimental PSF?) in a Wide Field Microscope should have certain value depending on the objective's Numerical Aperture. When something goes wrong in the stepper or Z motor, this angle is immediately affected. For more information on confocal axial calibration you can have a look at the Journal of Microscopy paper of Besseling et al. which is listed at the bottom of this wiki page.
Table of contents
The sampling problem
The Z sampling as reported by the microscope may not be realistic. This happens more frequently than you would think. Not because they are strange numbers but because, when you use them to describe the image, this doesn't fit at all what you would expect from your objective's NA or your biological sample. In such a case the image, interpreted with the reported sampling, produces extremely elongated objects in the Z direction!!! (The opposite can also happen, but we've seen that less).
This is something you don't notice just by looking at the XY slices in the stack, because it is visible only along the Z direction. See the following example. (*)
This is a 3D stack from a widefield microscope, taken with a NA = 1.4 lens. Using the Sampling Distances reported by the microscope (99 nm × 99 nm × 150 nm) we see the following:
A XY slice
Nothing is apparently wrong with this image, it looks very natural:
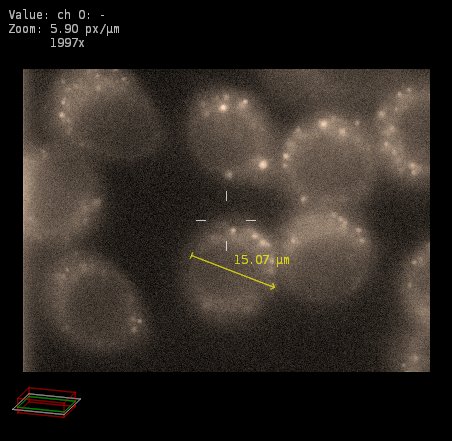
We may not know what biological sample is imaged here. I will describe this as a collection of about eight rounded objects with bright dots inside them.
With this original sampling, the rounded objects as seen in the XY plane have a diameter of about 15 µm.
A XZ slice
This 3D stack, on the contrary, looks extremely elongated along the optical axis. This is unrealistic considering that the image was acquired with a NA = 1.4 lens.
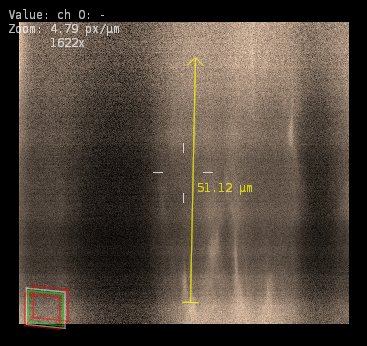
In this interpretation, the bright dots are actually vertical rods, and the rounded objects (which are about 50 µm tall) have an aspect ratio of 50/15 ~ 3. They are not spherical at all!!!
This doesn't look a natural biological sample: elongated structures that are perfectly aligned vertically? I would expect something more spherical, or even flattened against the glass slider, whatever this sample is...
Possible solutions
It looks as if the aspect ratio of the (XY)/Z sampling is wrong. To retrieve realistic results we have to assume that
- either the sampling along Z is about three times smaller (50 nm instead of 150 nm)
- or the XY sampling is about three times larger (300 nm instead of 99 nm)
The former can be caused by a failing Z-stepper that takes actual steps shorter than it reports.
The latter can be caused e.g. by the use of a factor of 3 Pixel Binning. When binning occurs, the pixel size in the image increases by the binning factor (a binned pixel covers a larger physical region than a normal pixel).
By assuming any of these possibilities, the XY slice keeps looking the same. This is because the XY aspect ratio doesn't change in any case.
At the same time, any of these possibilities restores the aspect ratio of the XZ view to produce something more realistic. What is shown below is a XZ slice as above but now assuming possibility 2 (that the real sampling in XY is 300 nm, possibly caused by binning):
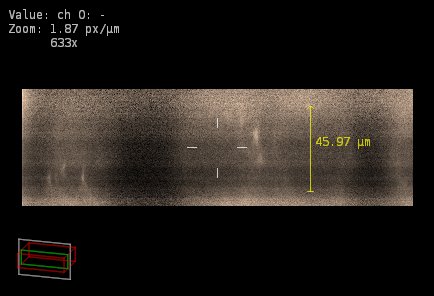
The two possibilities restore the aspect ratio of the image to something more natural (the rounded objects are now almost spherical), but the conclusions from both are very different:
- The round objects are about 15 µm in diameter
- The round objects are about 50 µm in diameter
What is the correct sampling?
The main question is which of the three assumptions about sampling makes more sense, not only from the physical point of view of the image description, but also from the biological description. Are the imaged biological samples, those eight rounded objects...
- elongated structures aligned along Z, with a XY diameter of 15 µm and a Z diameter of 50 µm (original assumption, sampling 99 × 99 × 150)
- round structures with a diameter in any direction of about 15 µm (assumption one, sampling 99 × 99 × 50)
- round structures with a diameter in any direction of about 50 µm (assumption two, sampling 300 × 300 × 150)
It would also be interesting to know how many pixels are present in the CCD camera; that would also help in deciding which of these assumptions is correct.
PSF and image comparison
To the eyes of the biologist, the question of the size of the imaged cells should be clarifying to determine the real sampling of the image: are these cells rounded like balls or elongated like cucumbers? If they are rounded, are they ~15 µm or ~50 µm in diameter? (They are HeLa cells, by the way. By knowing that you can already reach some conclusions).
To the eyes of the physicist, possibly ignorant of the biological contents of this image, what is more revealing of a possibly wrong description of the image is the fact that the internal small structures are so much different from the expected PSF. Take a look at the following images:
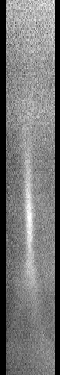

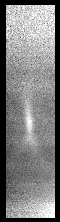
- left: XZ portion of the image around a small feature, represented with the original sampling (Δx = 99 nm, Δz = 150 nm).
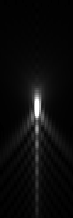
- right: theoretical PSF calculated for these optical conditions and for a depth inside the sample of 35 µm, approximately where the feature is located with the given z sampling.
The imaged feature is very much elongated, and the angle subtended by the peaks caused by SA at the bottom (very dim but still visible) is very much smaller than the expected one.
On the other hand, after correcting the Z sampling as suggested above (so that the HeLa cells become round and of a diameter of ~15 µm) the same small feature looks like this, much similar to the expected PSF at the new depth:
- left: the same original XZ portion, represented with a corrected z sampling ( Δz = 50 nm).
- right: theoretical PSF calculated for these optical conditions and for a depth inside the sample of 10 µm, approximately where the feature is located with the new z sampling.
This also suggests that the real z sampling is more on the order of 50 nm.
Calibrate the Z sampling
Too much uncertainty... In any case it seems clear that the sampling distances reported by the microscope are not correct. This was in fact a real case, and the user took action (*):
One possibility that I had to rule out was the accuracy of the z-stage; that is, if the Z-encoder claimed to move in (for example) 0.15 micron increments, in fact the stage did advance 0.15 micron per increment. After a phone conversation with the Huygens guys this morning, I made up a 'z-calibration' slide: fluorescent microbeads (1 um diameter) attached to both a 1.5 coverslip and a glass slide. These were assembled face-to-face using a #0 coverslip spacer and the cavity filled with Cargille immersion fluid. This constructs two layers of fluorescent particles separated by (about) 100 microns within in an index-matched medium. If I understand what the computer was telling me, the software instructed the z-stage to move 540 microns rather than 100 microns in order to get from one layer to the other. I now suspect there could be an error in the encoder or other part of the z-stage control path. I am unaware of any direct z-stage encoder calibration diagnostic, but I would like to have a technician come out the check the encoder accuracy.
Any other calibration sample that you can imagine (something thin, of known thickness) can be good to determine whether your stage is working properly or not. Another possibility is e.g. an electron microscope carrier grid between a glass slide and a coverslip: the EM carrier grids use to have a determined thickness and holes through which you can image the reflections on the two pieces of glass.
You can also have a look at this Open Access article: BESSELING, T.H., JOSE, J. and BLAADEREN, A. V. (2015), Methods to calibrate and scale axial distances in confocal microscopy as a function of refractive index. Journal of Microscopy, 257: 142–150. doi:10.1111/jmi.12194. In this article two easy methods are described to calibrate axial distances in 3D confocal microscopy.
-
(*) Images and quoted text courtesy of Dr. Andrew Resnick, Department of Physiology and Biophysics, Case Western Reserve University. Used with permission.