Huygens Data Plotter
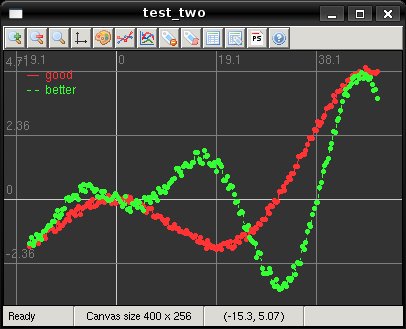
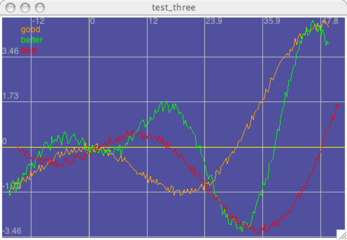
The Huygens Data Plotter is a graphical tool available in Huygens Professional and Huygens Essential for quick inspection of datasets like light flux or intensity profiles along a 3D image. The data plotter is available in the Twin Slicer, and also in the Deconvolution wizard.
Table of contents
Huygens version 3.3 and higher

- Left-click and drag to use the plot measurement tool
- Double-left-click to create a tag on the plot
- Right-click, drag, and release to zoom into a selected area
- Middle-click to reset the plot
- The scroll wheel zooms in or out
- The arrow keys pan
- C clears all tags
- D removes the last tag
- R resets the plot
- O shows the origin
- W changes the color scheme
- M changes the plotting mode
- Y toggles logarithmic scaling
- S exports the plot to Post Script
- E exports the data to Comma Separated Values (CSV)
- T exports tags to Comma Separated Values (CSV)
- H or F1 open the help page
- + zooms in
- - zooms out
Huygens 3.0

On the plotter window you have the following options:
- Moving the mouse over the image gives you the coordinates at the bottom of the window.
- Double-click or Ctrl+click tags a point on the plot with its coordinates.
- Clicking with the mouse right button draws a rectangle that serves as a measuring tool. Finishing the selection again with the same button zooms to the selected area. Clicking with the mouse left button hides the selector.
- Clicking with the middle-button or pressing the R key resets the zoom to fit the data.
- D deletes the last added tag, and C clears all of them.
- S saves the current graph as a Post Script file.
- E exports the data as Comma Separated Values (CSV).
- T exports the list of created tags as CSV.
- W changes the color scheme. Specially usefull is the gray scale one, for exporting the image.
- M changes the plotting mode, from lines to dots.
- Use the arrows for panning, and +/- for zooming in and out
- ESCAPE closes the graph.
- H or F1 opens this help article
