
Colocalization coefficients
Brief interpretation
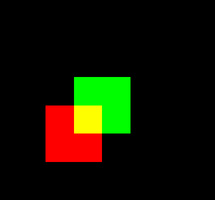 The purpose of a colocalization coefficient is to characterize the degree of overlap between two channels (normally called 'red' and 'green') in a digital image.
Different coefficients are usually defined to quantify this overlap. This is a list with the ones most commonly used in fluorescence microscopy, along with a very brief (and therefore incomplete) interpretation of them, to give an idea of what they measure. For more detailed information and formulas of all the coefficients in Huygens, see Colocalization Theory.
- Pearson's coefficient
- Named after Karl Pearson, and probably the most popular coefficient in statistics, it measures the degree of correlative variation of the two channels, more than how much they overlap. It gives a higher value (closer to one) the more the two signals change together from place to place, independently of their respective absolute values.
- Object Pearson coefficient
- Is the same as the original Pearson's coefficient, with the difference that the averages are not calculated over all the image voxels. Only the voxels which are not background (i.e. pixels above the threshold value) are taken into account for the average. This has the effect that the Pearson coefficient is calculated over the objects only, hence the name Object Pearson coefficient. By excluding background voxels, the bias of large background areas on the standard Pearson coefficient is prevented. Like in the Intersection coefficient, to reduce the effect of noise on the in- or exclusion of the voxels, voxels close to the background may contribute partially.
- Spearman coefficient
- Named after Charles Spearman and is similar to the Pearson coefficient. While the Pearson coefficient measures linear dependencies between the two channels, the Spearman coefficient detect all monotonic dependencies. The Spearman coefficient is the rank-order coefficient of correlation and is based on the ranking of image intensities. Consider an image which intensities are ordered, then the highest intensity will get rank 1, the second highest intensity will get rank 2 etc. This preserves the order and linearizes the data, over which the Pearson coefficient can be calculated. The Spearman coefficient is therefore defined to be the Pearson coefficient over the rankings of the image intensities.
- Object Spearman coefficient
- Is the same as the Spearman coefficient and similar to the Object Pearson coefficient. All voxels that are background in both channels are not taken into account, resulting in a coefficient calculated over voxels that belong to the object, hence Object Spearman coefficient. In contrast with the Object Pearson coefficient, it is not possible to reduce the effect of noise on the in- or exclusion of the voxels, because voxels cannot be included partially. This changes the rankings and thus the order of the data.
- Overlap coefficient
- Introduced by Erik Manders in his PhD thesis it gives, in a very rough interpretation, the ratio of intersecting volume to total object volume. This interpretation holds strictly only for the limiting case where the objects volume in each channel is the same and when the intensities are constant inside the objects. The intersection coefficients mentioned below are defined to hold this interpretation in all cases. See ColocalizationCoefficients.
- Manders' k1 and k2 coefficients
- Also from Manders' thesis, they are defined separately for each channel with the intention of quantifying possibly different colocalization levels (all red signal overlapping with some green one while the opposite is not true, for example). Still the interpretation of the numerical values is ambiguous, because they depend strongly on the ratio of total intensities in both channels.
- Manders' M1 and M2 coefficients
- A variant of the previous ones, they are defined separately for each channel so that they measure the portion of the intensity in each channel that coincide with some intensity in the other channel. Because when computing the coefficient for one channel voxels are considered to be colocalizing where there is some signal from the other channel (independently of its actual value), these coefficients are less dependent on the actual intensity ratios between channels. See ColocalizationCoefficients
- Global intersection coefficient
- Introduced by Scientific Volume Imaging in the Huygens Software analysis tools, and defined to provide straightforward, intuitive interpretation, it is the ratio of intersecting volume to total object volume. (It gives the proportion of object voxels that contain some intersecting signal). You can multiply this figure by 100 and interpret the result as a volume percentage.To reduce the effect of noise on the in- or exclusion of the voxels, voxels close to the background may contribute partially.
- Per-channel i1 and i2 intersection coefficients
- These coefficients split the previous global information so that it can be interpreted for each channel separately. They provide, per channel, the portion of the objects volume that is colocalizing with some object in the other channel.
- Van Steensels CCF
- The Van Steelsels Cross Correlation Function (CCF) shows how the Pearson coefficient changes after shifting the red image voxels over the green image. By observing the shape of this CCF plot as function of this shift, it can be determined if the signals of the two channels are actually positively correlated (peak at the center), mutually exclude each other (dip at the center), or simply overlap randomly (no features visible).
- Li's ICQ
- For each voxel in your image, the Intensity Correlation Quotient (ICQ) checks if the intensities of both channels differ in the same direction from their means. The ratio of the voxels that deviate with the same sign in both channels are divided by to the total number of voxels. This ratio is shifted to sit between -0.5 and +0.5 and gives insight to how much the signals in your channels colocalize, mutually exclude, or are randomly stained. A set of Intensity Correlation Analysis (ICA) plots are also generated.
More information
- To see a selection of these coefficients in action, and find out how they change with varying conditions, see Colocalization Coefficients.
- To see how these coefficients are mathematically defined, what they actually mean, and how they are affected by threshold settings, see Colocalization Theory.
- To do colocalization analysis on your images, please use the Colocalization Analyzer tool in the Huygens Software. For a free test version, see: test Huygens.