
Segmentation groups
Segmentation group is a term used in Huygens to describe each of the independent components of a complex visualization result. In older versions of Huygens the term (Graphics) pipe is used instead.
Segmentation
Suppose you have an image consisting of multiple cells that you want to analyse. For instance, you might want to determine the volume of each cell, or you might want to measure the distance between two cells. In order to do so, the imaging software you're using first needs to determine the boundaries of the cells, for instance by using a Threshold Criterion. Generally speaking, the process of automatically selecting interesting features in an image is called Segmentation. In Huygens, you can segment your image in the Object Analyzer or the Surface Renderer; for further analysis the use of the former is recommended.
Uses of segmentation groups
In many cases, applying a single segmentation method is not enough to identify all interesting objects in an image. In case of an image of a cell you might want to display both the cell membrane as the internal organelles. But by setting the threshold on a value low you would only see the former, because then the internal organelles cannot be distinguised from the cytoplasma (see image b below); in case of a high threshold you would only see the internal organelles (c). Segmentation groups are Huygens' solution to this issue. One can use one segmentation group with a low threshold to show the membrane, and another group to display the internal organelles (d). Furthermore, you can adjust the hue, brightness and transparency for each group individually to further improve the visualisation (e).
Segmentation groups also prove to be very useful when working with a Multi Channel image. Since the segmentation methods used in Huygens only work on one channel at the time, you will need to use multiple segmentation groups to render multiple channels at once.
A third case were segmentation groups can be used is to display a Maximum Intensity Projection (MIP) of a channel. This can be useful as a spatial refence.
Segmentation groups in Huygens
In the Huygens Software some visualization and analysis tools (in particular the Surface Renderer and the Object Analyzer) use segmentation groups that you can use to control the segmentation of your image data and how they are displayed in the final 3D rendering.
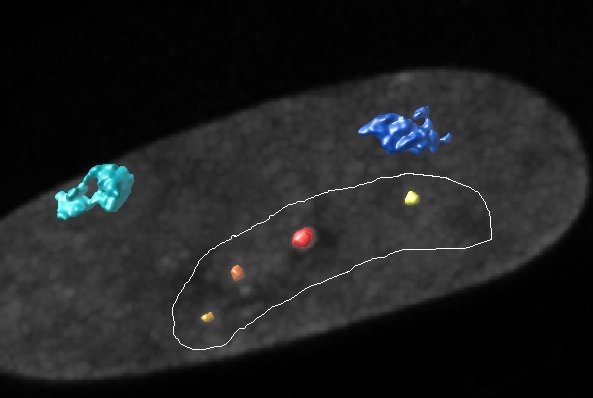
See the following example: a three channel image of a cell nucleus is visualized in Huygens' Object Analyzer. One segmentation group contains the 2D maximum intensity projection of the nucleus’ DAPI channel (channel 2 in the image) as spatial reference. The other two segmentation groups are used to display the Iso Surface of objects in channel 1 and channel 0 (one of these with red-yellow colors, the other one with bluish colors). The three active segmentation groups are combined together in the final 3D rendering, and each part of the MIP is placed at its correct place of the visualization volume so some parts of the iso-surfaces are below and others above it.
More specifically, Huygens' Object Analyzer has two segmentation groups (named Primary and Secondary) for you to put image data into for object analysis, another group to simultaneously visualize a MIP of one of the channels, and another group to visualize the ROI.
When you first open the Object Analyzer, the primary segmentation group is set to display channel 0; the others are inactivated (set to channel "None"). If want you to activate one of the other segmentation groups, click on the corresponding tab (e.g. Scnd for the secondary segmentation group) and select the channel you want to display in the dropdown menu. Note that the Primary and Secondary segmentation groups function in the same way, the former is not more important than the latter. In the Object Analyzer, in the statistics table at the bottom part of the screen, under the column SegGroup, a 0 refers to the Primary group and 1 refers to the Secondary group.
For more information about using segmentation groups in the Object Analyzer, see svi.nl/ObjectAnalyzerExpertTutorial#Segmentation_groups.