
Undersampling
Undersampling is the effect of having too large Sample Sizes (too few samples or low Sampling Density) during acquisition, which produces a 3-D stack with hardly any relation between adjacent Voxels.
The ideal sampling density depends on the optics of the microscope. As the Point Spread Function (PSF) is the basic "brick" of which the images are "built", one should record details at least on the scale of the PSF to gather all the available information. Deconvolution is an operation working on the PSF scale and the Image Restoration may be useless when the acquisition is done at a larger scale, because it lacks the necessary information.
It is therefore important to know how the sampling conditions should be established during the acquisition in order to recover an image from the sampled values. How you should sample your object depends on your Microscope Type -Wide Field Microscope (WF) or Confocal Microscope- and on the Microscopic Parameters used, like the Numerical Aperture and Wavelength of the light. The correct sampling distances are determined by the Nyquist Rate.
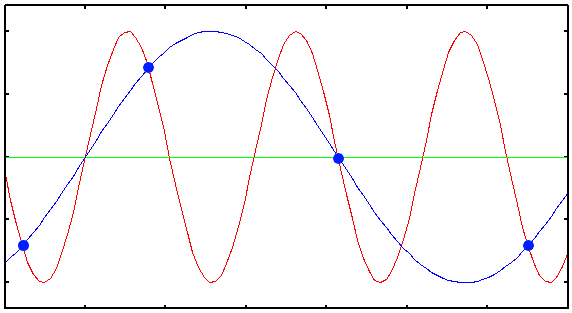
Undersampling is bad not only for quality of deconvolution (see Quality Vs Sampling): an undersampled acquisition disregards relevant information present in the microscope image. If you sample below the Nyquist rate you get Aliasing Artifacts (Moire patterns, staircasing).
Undersampling warnings
In the Huygens Software the sampling you enter to describe your image is compared to the Nyquist Ideal Sampling. If it is large or too large you get orange or red colors in the field entries. This is merely informative, nothing is done to your data: the image will be deconvolved anyway using the actual parameters you entered. But the further you are from the ideal sampling the less deconvolution will improve the image. Therefore, the coloring and the warnings are simply to let you know that your original data won't improve too much, and that you'd better reacquire your images again with a more correct sampling.
You can calculate the ideal sampling for your setup using the Nyquist Calculator.
See also Bleaching Vs Sampling, and the wiki page on Acquisition Pitfalls.