
Signal-to-Noise Ratio (SNR)
The Signal-to-Noise ratio (SNR or S/N) reflects how well the signal of interest coming from the sample can be distinguished from noise on the microscope detector. A high SNR means that the signal you are interested in is clearly visible and easy to interpret.
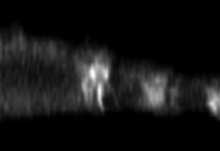
The same image with different Signal-to-Noise ratios. The original image is courtesy of Vishakha Vishwakarma, Louisiana State University, USA. The image depicts a zoom of the E-cadhrin mesh in the Drosophila embryo salivary gland.
SNR is not background!
Although related, it is important to note that noise is not the same as background signal! Noise is not calculated by dividing signal by background (that would be the signal-to-background ratio SBR). Noise is slightly more complicated, and describes the error or spread around a true signal. Like SNR estimation, background estimation is also part of the deconvolution procedure.Causes of noise
In fluorescence microscopy, the signal of interest are the photons that originate from the sample. Noise describes any unwanted signals, that make it harder to distinguish the signal of interest. Different types of noise are: optical noise, read noise, dark noise and shot (Poisson) noise.Optical noise
Optical noise is any light coming from the sample that does not belong to the structure of interest and is caused by high background staining or autofluorescence. Optical noise is the most important source of noise in microscopic images. The main source of a high background and the resulting low SNR is poor sample preparation. Therefore, always pay close attention when staining the sample and adjust the concentrations of fluorescent dyes or the staining protocol if you obtain a low SNR continuously. Moreover, a high background noise can be due to light from the environment, so make sure you are imaging in a room with low light conditions.Read noise
Read noise is the noise that occurs when reading out the pixels of a CCD or CMOS camera. Individual pixels release electrons (charge) that is converted by an Analogue-to-Digital converter (ADC). Converting these electrons to digital values can introduce noise. Read noise is strongly related to the sensitivity of the detector, a low read noise means a lower amount of electrons can still distinguished. This means that for low read noises you can determine smaller fluctuations in charge and thus in intensity. The read noise therefore determines the contrast resolution of the camera.Dark noise
Dark noise (or dark current) is noise generated by heating of the detector. During image acquisition the electronics in the camera produce heat, warming up the detector. This causes thermal electrons to build up in the pixels, that are summed with the photoelectrons generated by each pixels. The additional thermal electrons cannot be distinguished from photoelectrons, and therefore the heat in the detector generates noise. Since this noise is related to heat and will be present even if there is no light, it is termed dark noise. Dark noise contributes to high blacklevel in images.Shot (Poisson) noise
Shot noise (also referred to as photon or Poisson noise) is caused by the physical properties of light. Light intensity is the amount of photons emitted over time. However, due to the particle properties of light, not all of the photons are emitted at the same time and travel at the same speed. Therefore, when imaging a constant light source, you will detect a trickle of photons that fluctuates over time. If the light intensity is 30 photons per second, and you image for one second multiple times, you sometimes detect 28 photons and sometimes 32 photons. The variation around the mean light intensity is a poisson distribution. In point scanning imaging, this results in slight variations of detected photons even when the light intensity and dwell time is the same between two point. These fluctuations introduce noise to the image.SNR in the Huygens software
The Huygens software estimates the SNR automatically. The SNR is one of the most important factors for image deconvolution. To ensure correct deconvolution, it is important that the estimated SNR matches the 'true' SNR of the image.In most cases, the automatically estimated SNR is accurate for deconvolution. However, if the estimate is not reliable, the SNR has to be determined manually, see determining the SNR on this page.
Image deconvolution is optimal if the SNR is estimated correctly. However, for the deconvolution via ICTM and MLE, initally only a rough SNR estimate is required.
It is possible to adjust the SNR in an iterative manner to get improved deconvolution results. However, if you have a rough estimate of the SNR you can use the acuity slider in the Huygens deconvolution express and wizard. This setting allows you to change the sharpness of the deconvolution result without modifying the SNR. See Tuning Huygens Deconvolution.
Throughout the Huygens Software, the automatic SNR estimation of a digital microscopic image is defined as the square root of the number of photons in the brightest part of the image. The idea behind this is that a Poisson Distribution is assumed for the Photon Noise. Following this assumption, the "error" σ is the square root of the expectancy value P. Thus, the SNR would be
$$ \text{SNR} = P / \sigma = \frac{P}{\sqrt{P}} = \sqrt{P} $$
If you know the conversion factor c (also called system gain) of your detector (e.g. a CCD camera), calculating the SNR with the above definition is instant. This conversion factor of your detector determines the number of electrons needed to increase the grey-value i of a VoXel a single level:
$$ N_{electrons} = i c $$
(The c factor refers to electrons, not photons, because photons excite electrons in the detector that are actually "measured" by the electronics of the device. The conversion from photons to electrons is characterized by the quantum efficiency of the detector. An ideal detector, that accounts for all the captured photons, has a quantum efficiency of one. In any case we don't care here about the photons that were not detected, but only about those registered in the image.)
Given the c factor and the intensity value i_max of the brightest voxel in the image, the SNR is simply
$$ \text{SNR} = \sqrt{ N_{electrons,max}\ } = \sqrt{ i_{max}\ c } $$
Intensity levels as reported by your detector (the i in the above equations) are sometimes said to be measured in ADU, analog-to-digital units, so the c would have ADU-1 units.
When the c factor is not available, the SNR can not automatically be estimated. The SNR then needs to be determined in another way, as described below.
Reliability of automatic SNR estimation
In the Huygens quality control tool the automatic SNR estimate is given a reliability score between 0 and 1. Important to note is that the reliability score is not an indication of high or low SNR. The score only gives an indication how accurate the automatic SNR estimate is. If the estimate is not reliable, it is advised to determine the SNR manually. Multiple ways to do this are described below.Determining the SNR
If you are using Huygens software to restore your image you can determine the SNR of your image in multiple ways. You can estimate the SNR by rule of thumb for the microscope you used, by estimating by eye, make an estimation based on the single photon intensity or derive the SNR experimentally.A word of caution; if you have clipped images you may not be able to properly determine the SNR, because the maximum or minimum intensities present in the image are not realistic.
Rule of thumb
To get an indication of the SNR range of your image you can consider the typical SNR ranges of different microscope systems.
Estimating the SNR this way is imprecise, but will give you a rough starting point. It is recommended running multiple deconvolution interations with adjusted SNR values to determine the best deconvolution result.
Estimating the SNR this way is imprecise, but will give you a rough starting point. It is recommended running multiple deconvolution interations with adjusted SNR values to determine the best deconvolution result.
Typical SNR values
- Bad quality confocal image: SNR = 5-10
- Noisy confocal image: SNR = 20
- Good quality confocal image: SNR = 30-60
- Good quality widefield image: SNR > 40
- Microscope with cooled CCD camera: SNR = 50-100
Visually estimate SNR
To quickly determine the SNR of your image you can quickly estimate the SNR by eye. In the images below you can see how different SNR ratios affect the image. You can use these to visually estimate the SNR of your image by comparing the 'granularity' of these sample images and your original image. This method is also imprecise, and you may want to try out several iterations using different SNR values to get the best deconvolution results.Estimated SNR
In Huygens, the SNR of a digital microscopic image is defined as the square root of the number of photons in the brightest part of the image. The intensity values in the image can be used to determine the amount of photons and the SNR.Estimating the SNR in noisy images is surprisingly easy: we will outline the procedure in step-by-step form below. In low noise images it is much more difficult. Fortunately, low noise images do not need a highly precise SNR estimate.
High noise
For high noise images (low SNR) the SNR can be determined by estimating the intensity value of a pixel from a single photon 'hit'. Most dots in the background or dark parts of an image originate from single photon hits, making these usefull for determining the SNR. You can follow the steps below to make an estimate of the SNR1. Open the image in the Slicer (Double click the image in the main window or go to Visualization > Slicer), set the projection mode to "slice".
2. Zoom in on a dark region of the image untill you can see individual pixels. It might help to increase the contrast.
3a. Esstimate the intensity of a single photon hit. To do this, place your cursor over the pixels in the image that have a similar low intensity (pixel value is displayed at the top left in the slicer, if not, select Intensity values from the View menu). This gives the intensity of value corresponding with a single photon hit, the isingle.
3b. Considerations for estimating the single pixel hit value. Getting the correct pixel value can be tricky, as individual pixels might show a high variance in intensity.
5. Substract the black level. In good detectors the black level is usually 0, it is the minimum pixel value ("Min value" in Huygens) in the image. You can find it under the Statistics tab in the main window as well, below the Max value. If the blacklevel is greater than 0, substract it from both the isingle and imax, this is particularly important if the black level is substantial.
6. Finally, calculate the amount of photons in the brightest parts of our image by simply deviding the max by the isingle. To determine the SNR, take the square root the maximum amount of photons. You can calculate the SNR using the following equation:
$$ \text{SNR} = \sqrt{ \frac{i_{max}}{i_{single}} } $$
make sure to use the blacklevel substracted values if there was a >0 blacklevel in the image.
7. Using and adjusting the SNR. This method generally underestimates the SNR in the image. Therefore, you can use the SNR you obtained for deconvolution, and adjust it later if you are unsatisfied with the result.
2. Zoom in on a dark region of the image untill you can see individual pixels. It might help to increase the contrast.
3a. Esstimate the intensity of a single photon hit. To do this, place your cursor over the pixels in the image that have a similar low intensity (pixel value is displayed at the top left in the slicer, if not, select Intensity values from the View menu). This gives the intensity of value corresponding with a single photon hit, the isingle.
3b. Considerations for estimating the single pixel hit value. Getting the correct pixel value can be tricky, as individual pixels might show a high variance in intensity.
- Make sure take the lowest (not 0) pixel value in the image, that occurs regularly.
- If there are many photons of the same low value close together, but no distinct clusters, use the value of a single photon.
- If you find groups of pixels that have a low intensity in an otherwise completely black region, you can sum these values. This is because one photon hit is generally distributed over two or three pixels, so to determine the intensity of a single photon you might want to sum the intensity of these pixels with a similar low value.
- Keep in mind that determining the single photon hits is only possible in high noise images, if you are unable to determine single photon hits, you might want to use a rough estimate instead.
5. Substract the black level. In good detectors the black level is usually 0, it is the minimum pixel value ("Min value" in Huygens) in the image. You can find it under the Statistics tab in the main window as well, below the Max value. If the blacklevel is greater than 0, substract it from both the isingle and imax, this is particularly important if the black level is substantial.
6. Finally, calculate the amount of photons in the brightest parts of our image by simply deviding the max by the isingle. To determine the SNR, take the square root the maximum amount of photons. You can calculate the SNR using the following equation:
$$ \text{SNR} = \sqrt{ \frac{i_{max}}{i_{single}} } $$
make sure to use the blacklevel substracted values if there was a >0 blacklevel in the image.
7. Using and adjusting the SNR. This method generally underestimates the SNR in the image. Therefore, you can use the SNR you obtained for deconvolution, and adjust it later if you are unsatisfied with the result.
low noise
In low noise images you cannot see the individual photon hits anymore. Methods exists where the energy in the image outside the band limit (which can only be due to noise) is compared to the in-band energy. Other methods rely on information gathered during the averaging of single scan lines, and must therefore be integrated in the microscope image acquisition software. In principle one could establish the SNR accurately from a series of images (sections) taken at the same z-position.Fortunately, in the case of low noise images the SNR is of good quality, therefore getting a correct estimate is much less important for deconvolution. Both the ICTM and MLE restoration methods only need a rough guess of the true SNR, therefore you can use the rule of thumb or visual estimation to get an initial SNR estimate.
Experimental measurement
The correct method to estimate the SNR must find the Standard Deviation (SD) around the maximum level, the "noise" around what is defined to be our "signal". Ideally, one would introduce in the sample a large homogeneous high intensity plateau, where (because of the present noise) some standard deviation would be measured.Unfortunately this is experimentally difficult, and you almost never have a large volume with high constant intensities. The maximum in a real sample is usually very much localized (in some features of the objects) and intensity varies quickly around it, therefore you can't assume that its SD is due to noise only.
If you still imagine that you can do such experimental preparation, then the ratio between maximum (averaged) value and its SD would provide the SNR. (We focus on the number of photons, not on recorded intensity, but the two values are ideally related by a constant c, the camera conversion factor.)
The SD around the maximum intensity M in such 'calibration' plateau would be, in absence of other experimental artifacts, caused by the intrinsic Poisson statistics of the photon-electron events. And in such statistics, the SD is
(proportional to) the square root of the number of photons. This means that:
$$ \text{SNR} = \frac{ M }{\text{SD}} = \frac{c\ P}{c\ \sqrt{P}} = \sqrt{P} $$
Because of the difficulties in determining the SNR experimentally, it is adviced to estimate the SNR roughly at firsts, and refine the estimate with several iterations of deconvolution runs.
Improving the SNR estimate
As mentioned throughout this page, in practice you start out with a SNR number derived either from the automatic Huygens estimation, or by estimating the SNR manually via the options for determining the SNR as described above. Subsequently you do a deconvolution run and inspect the result for artifacts and residue background. If you are confident all is fine you can rerun the restoration with a higher SNR setting (say 30%-50%) and perhaps a higher background. After this run you compare the results. this is easiest with the Batch-Feeder where you can copy the same file as often as needed and alter the SNR value in the deconvolution template for each copy. You can compare the results using the Twin Slicer. Each deconvolution run has a increasing numerical suffix in the image name. Repeat this process until you find the highest SNR value that doesn't create artifacts by enhancing noise. See also Tuning Huygens Deconvolution.If you have done this a previous time for a similar image then of course you can just use the values established then!
Potential drawbacks of wrong estimations
The SNR number controls what you can think of as an artifact limiter. If you set it 'high', noise, if present, will be amplified. Also other distortions in the image formation might get amplified. A low SNR setting will attenuate these artifacts at the cost of the final resolution in your image.Underestimating the SNR
If your estimation is too low, relevant information in your data will be considered to be noise and removed in the high-frequency regions. The resulting image will be too smooth, lacking details, as can be seen in the image to the right. See the FAQ What is the potential drawback of estimating the signal to noise ratio (SNR) to low? for more information.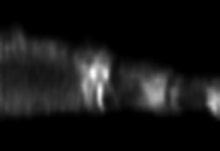
Overestimating the SNR
If the estimation is too high, noise may not be properly removed and some artifacts generated. For example, a noisy background may lead to the appearence of tiny objects with certain structure in the restored image. In the image to the left you can see there is an artificially generated internal structure in the object, in the dark inner region at the left side of the object.SNR overestimation causes noise amplification
An even more obivious example of artifacts due to SNR overestimation can be seen below. Notice the green dim structures in the background, they probably are noise amplification only. For quantification of these effects, see Artifacts Or Features.Raw image
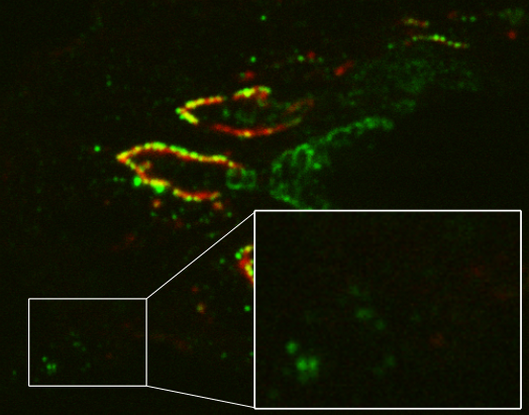
Deconvolved image with an overestimated SNR
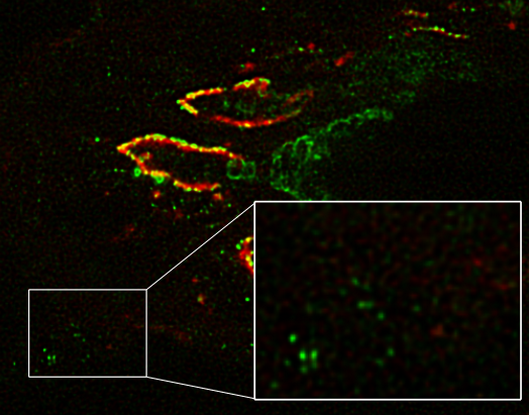
Images courtesy of J.A. Valentijn, Molecular Cell Biology Dept., Leiden University Medical Center. The raw image was acquired with a Bio-Rad 2100MP confocal/multi-photon system (multi-photon option was not used here). The image was taken from a 7 micrometer thick cryostat section of rat colon tissue that was fixed in 4% paraformaldehyde. The section was labeled with rabbit antibodies against the small GTP-binding protein, rab3D, and secondary Alexa-488 goat anti-rabbit antibodies (green channel), and with Alexa-594 labeled Griffonia simplicifolia II lectin. Each V-shaped fluorescent structure represents the Golgi apparatus of a goblet cell (the mucus secreting epithelial cells in intestine). Images used with permission.
More information
See the FAQ What is the potential drawback of estimating the signal to noise ratio (SNR) to high? for detailed information on the effect of SNR overestimation on the different Restoration Methods.Read also http://www.photomet.com/library_enc_signal.shtml and http://www.photomet.com/library_enc_detect.shtml (Photometrics).
References
1. https://www.leica-microsystems.com/science-lab/microscopy-basics/technical-terms-for-digital-microscope-cameras-and-image-analysis/2. https://www.adimec.com/read-noise-versus-shot-noise-what-is-the-difference-and-when-does-it-matter/
3. https://www.photometrics.com/learn/advanced-imaging/dark-current
4. https://scientificimaging.com/knowledge-base/signal-and-noise-graphical/